About
The Partnership for Gulf Coast Land Conservation (Gulf Partnership) Strategic Conservation Vision tool was developed to help guide strategic land and water conservation across the Gulf of Mexico. The model incorporates partner priority areas, and numerous conservation data measures, including priority Longleaf Pine conservation areas, wetlands (>10 ha), migratory bird stopover habitats, conservation working lands, connectivity of natural lands, and composition of riparian zones.
Reporting is based on a 3-tiered format (Tier 1 Highest), with increasing priority for multiple conservation indices alignment. Using this tool, you can create a custom report detailing tier priority acreage and habitat types throughout your area of interest.
![]() Some key features:
Some key features:
- Quickly create custom prioritization maps and reports
- Define areas of interest by drawing or uploading shapefiles
- Export shapefile, GEOJSON, or CSV files
Intended Use
The Strategic Conservation Vision tool is not intended to be prescriptive. This tool was designed to provide data to support the conservation planning of the Gulf Partnership. While the use of this tool is strongly encouraged among any conservation organizations, all users acknowledge that this model is intended to explore the ecological benefits of proposed areas and is not to be used in a decision-making context outside of its intended use.
Map
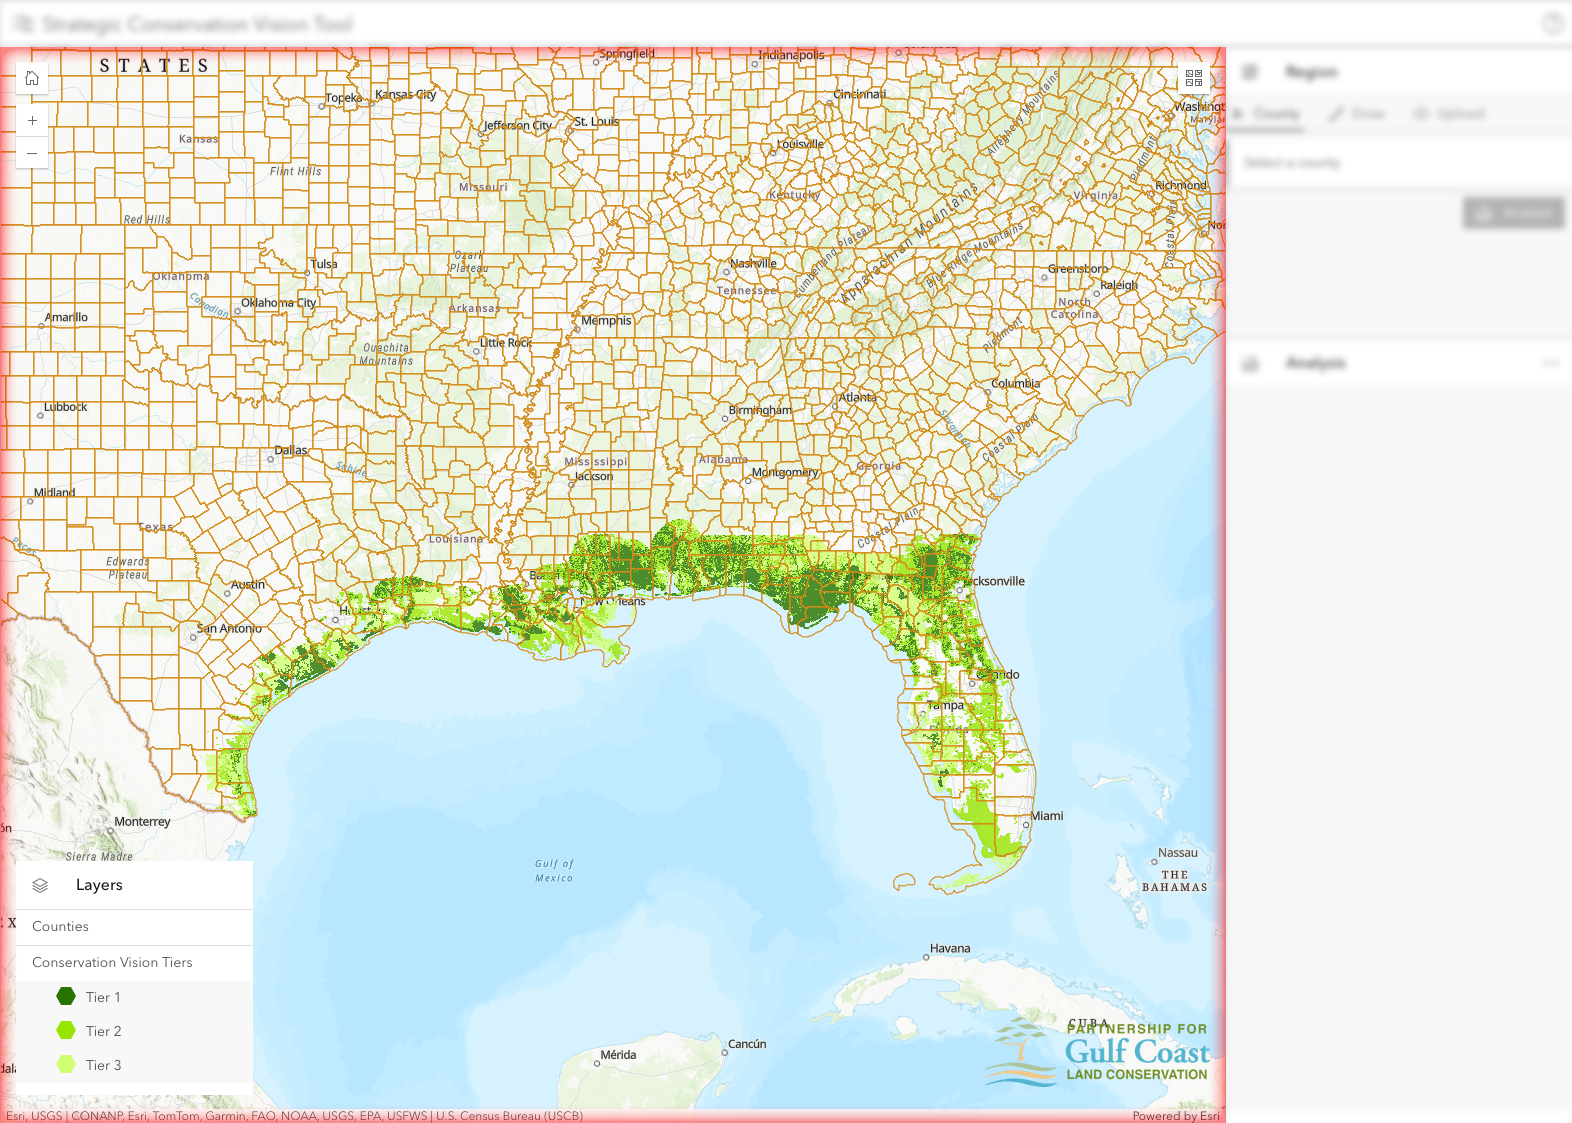
The primary view for the Strategic Conservation Vision Tool is the 2D, interactive map area. Initially, the map area shows you the extent of the Conservation Vision Tiers feature layer. It allows you to zoom into an area of interest and select county features or draw polygons to spatially filter the tiers.
Navigation
You can easily manipulate the map view using the mouse and touch controls listed in the table below.
| Action | Map Behavior |
|---|---|
| Drag | Pan |
| Double-click | Zoom in at the cursor |
| Ctrl+Double-click | Zoom out at the cursor |
| Scroll forward | Zoom in at the cursor |
| Scroll backward | Zoom out at the cursor |
| Right-click+Drag | 2D-rotate |
| Shift+Left-click+Drag | Zoom to the extent of the drawn graphic |
| Arrow Keys | Nudge the view to left, right, up or down |
| N | Adjust the view to point north |
| A | Rotate the view counterclockwise |
| D | Rotate the view clockwise |
| + | Incrementally zoom in at the center of the map |
| - | Incrementally zoom out at the center of the map |
| Drag with one or multiple fingers | Pan |
| Double-tap with one finger Zoom | Pan at the finger position |
| Two finger pinch in/out | Zoom out/in |
| Move two fingers in clockwise or counterclockwise direction | Rotate |
There are buttons in the top left of the map that can also aid in navigation. The
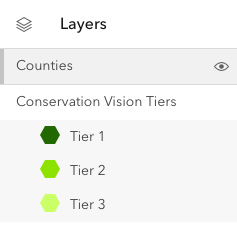
Layers
The layer widget, located in the bottom left corner of the map area, shows the current map layers as well as a legend for the Conservation
Vision Tiers layer. You can
toggle
the visibility of individual layers by clicking on the
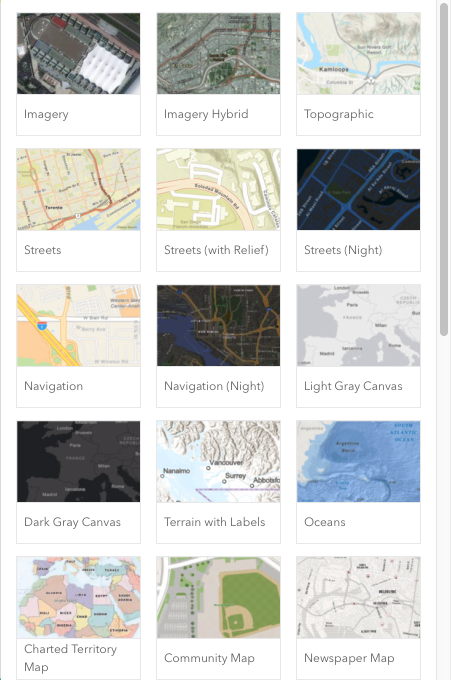
Basemap
If you would like to change the basemap, you can click on the
Area of Interest
There are several methods to define the area of interest that you are interested in analyzing. These methods include selecting a state county, drawing polygons, or uploading a shapefile. You can select how you want to proceed using the Region panel located to the right of the map view. Select the method you want to use by clicking on the appropriate tab at the top of the Region panel.
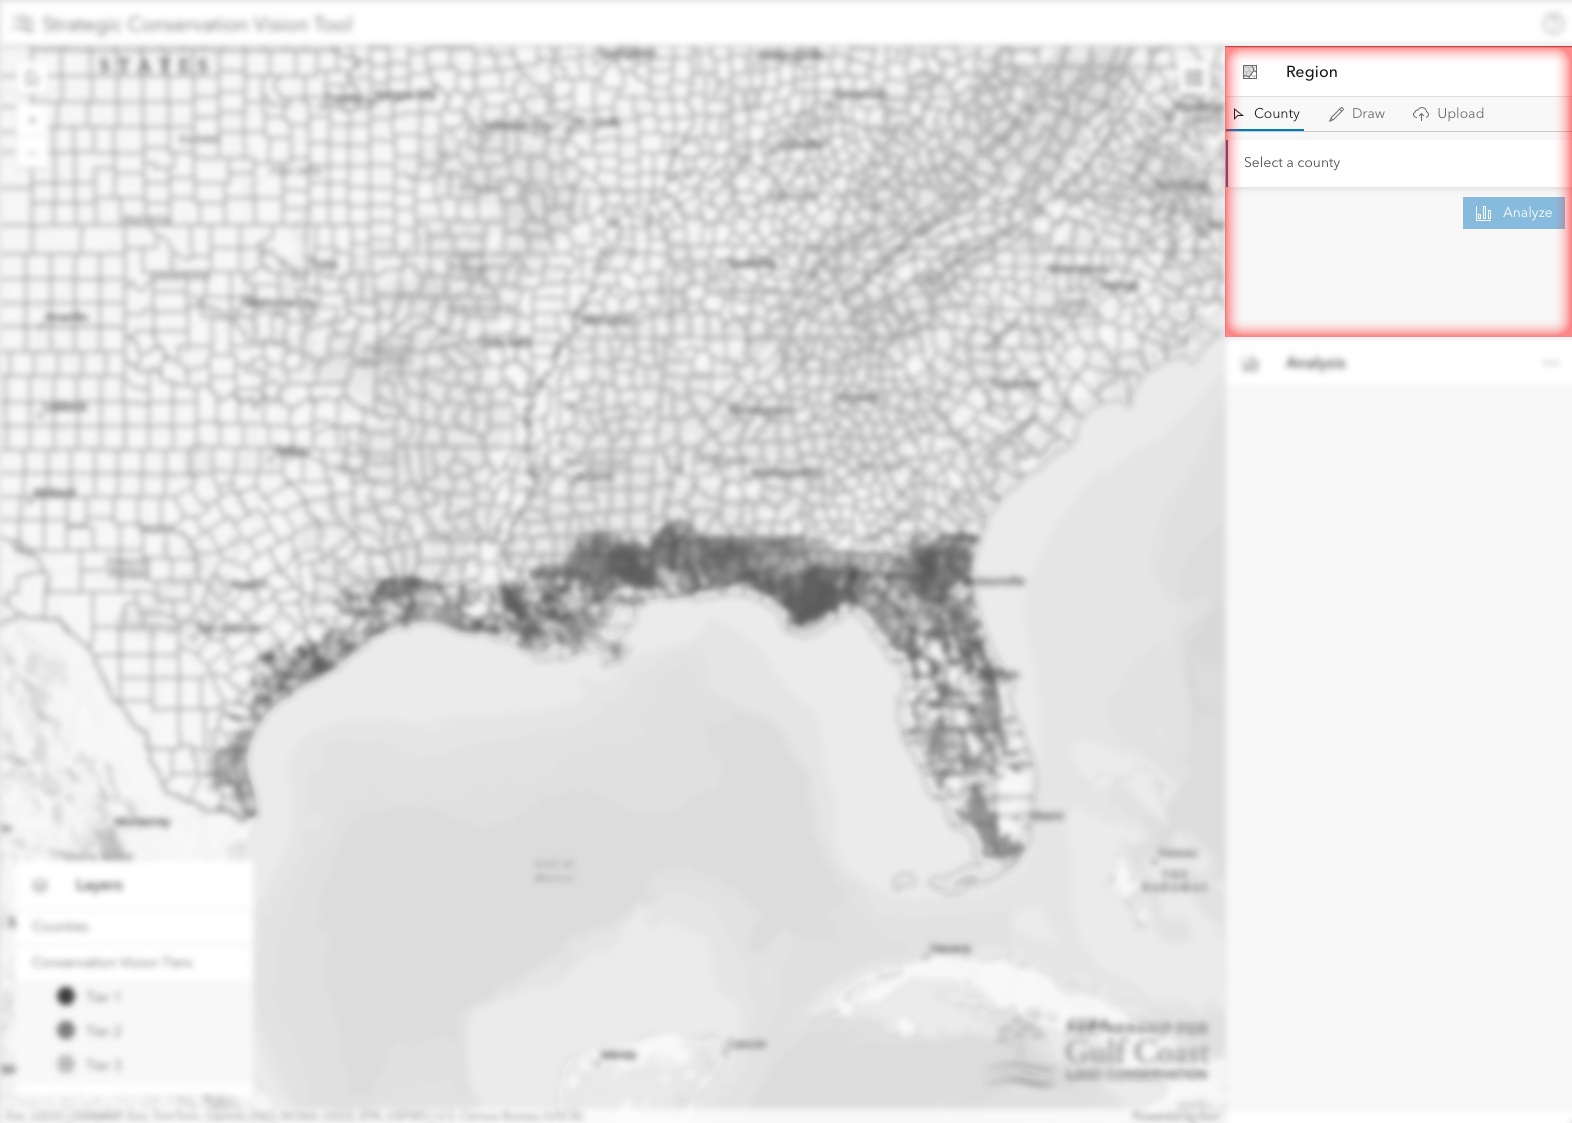
Select county
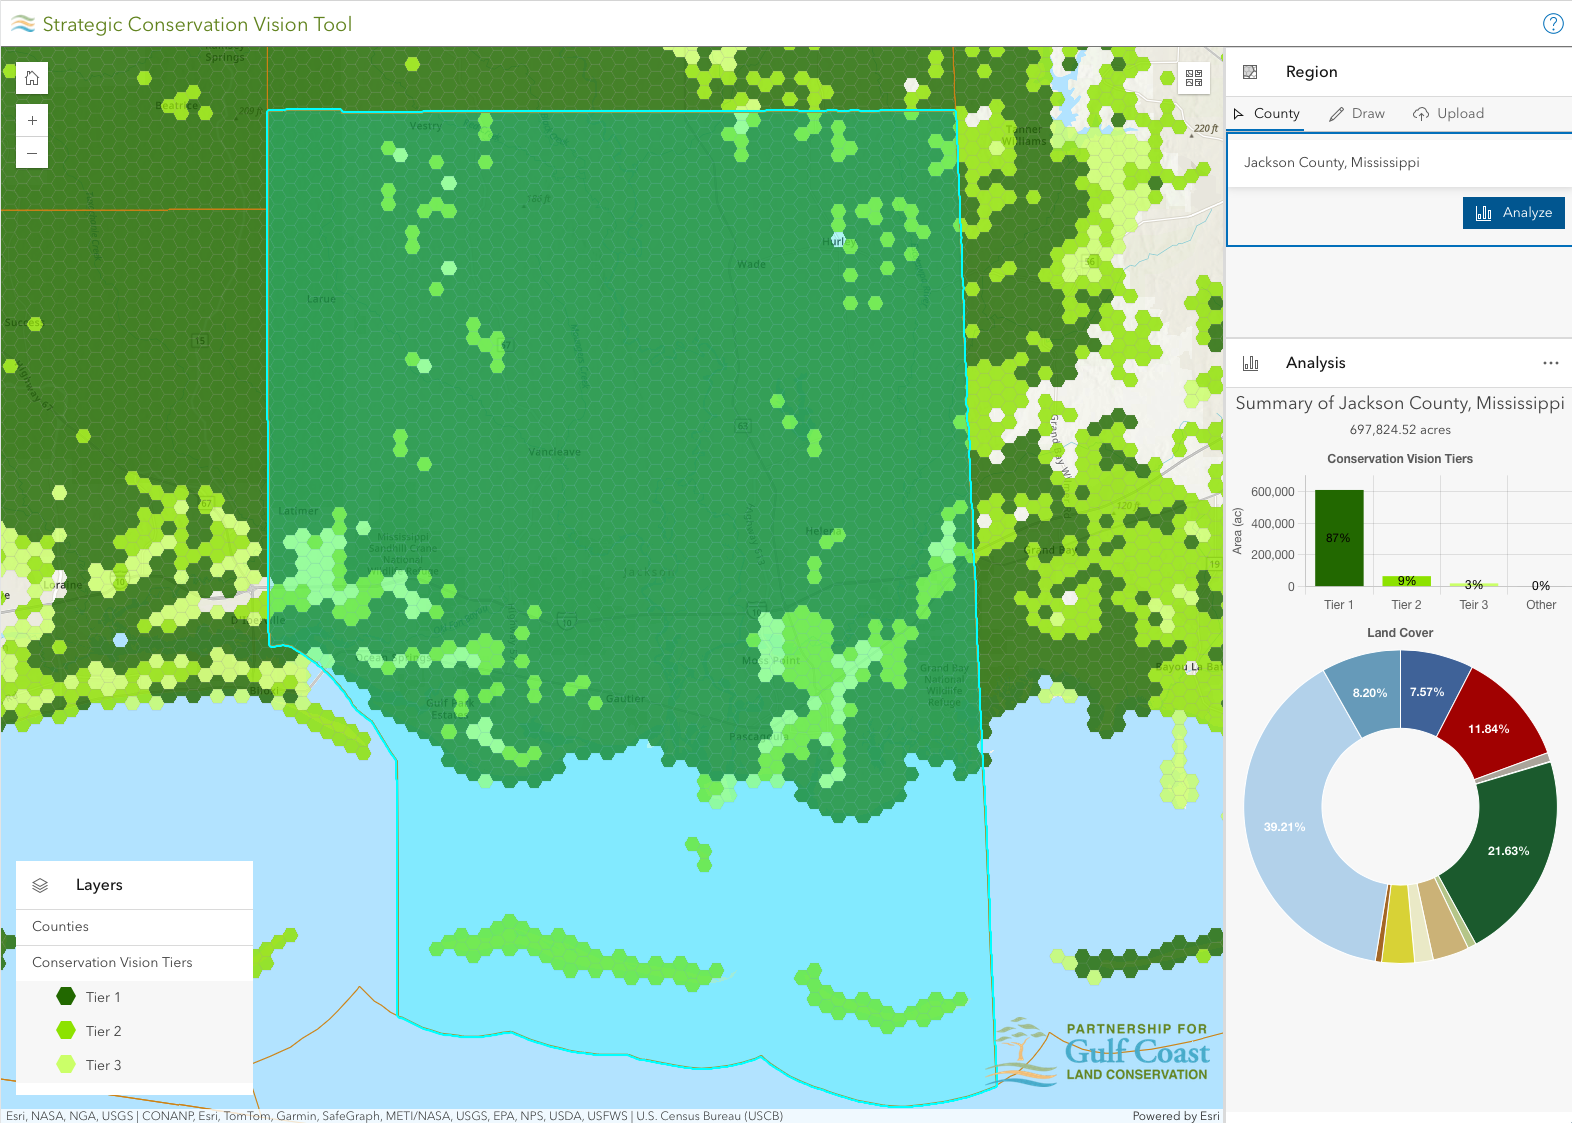
With the County tab selected, choosing an area of interest is simply a matter of clicking on a county in the Map view. The selected county will be highlighted and the county and state name will be displayed in the Region panel.
Draw
The Draw tab allows you to draw and edit complex polygons to define your area of interest. The controls in the Draw component are described in the table below.
| Behavior | |
|---|---|
| Click to select a previously drawn feature Shift-click to add to the current selection |
|
| Click and drag to select one or more previously drawn features | |
| Click and drag to draw a lasso around the one or more previously drawn features you want to select | |
| Draw a polygon by clicking to add points. Finish the polygon by double-clicking the final point | |
| Draw a rectangle by clicking and dragging to define the its size | |
| Draw a circle by clicking and dragging to define its size Draw an oval by holding shift and clicking and dragging to define its size |
|
| Undo edits performed on the currently selected feature(s) Note: changing selection will lose edit history |
|
| Redo edits performed on the currently selected feature(s) Note: changing selection will lose edit history |
|
| Duplicates the currently selected feature(s) | |
| Deletes the currently selected feature(s) |
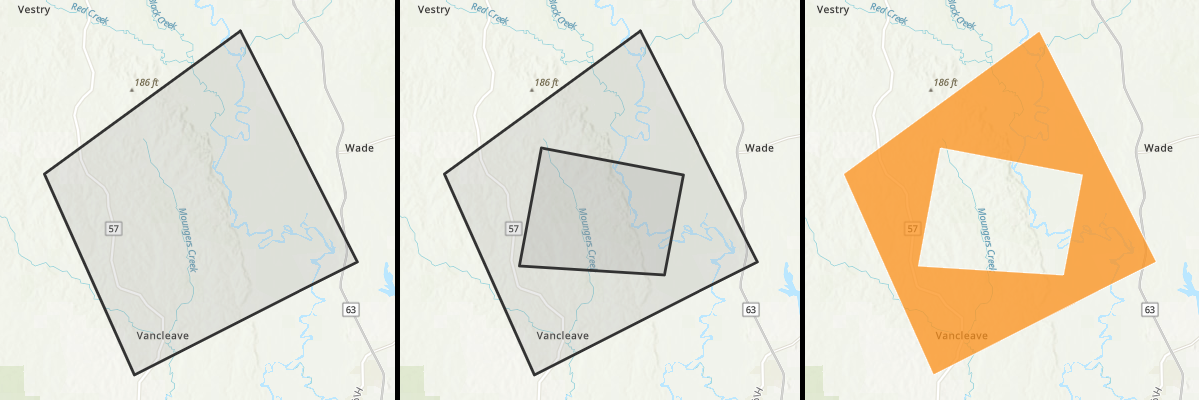
You can draw more complex shapes such as donuts or features with holes by drawing a feature inside of other another feature. To create the holes, the inner feature needs to be completely inside the outer feature.
Edit features
By selecting a feature or features, you can transform the geometry by translating, scaling, or rotating. On an individual feature, you can also edit the feature's geometry by adding vertices, deleting vertices, or translating vertices.
To transform features, select the feature or features you want to edit. A bounding rectangle with control points will surround the feature(s). The square control points allow you to scale the geometry and the round control point allows you to rotate the geometry. To translate the feature(s), simply click inside the geometry and drag the feature(s) to a new location.
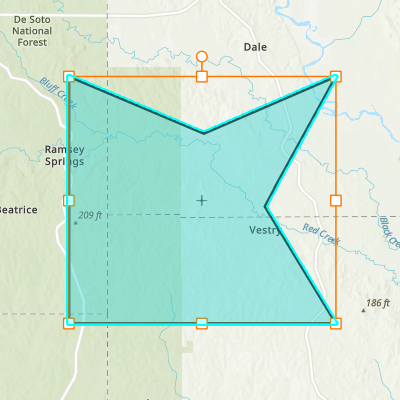
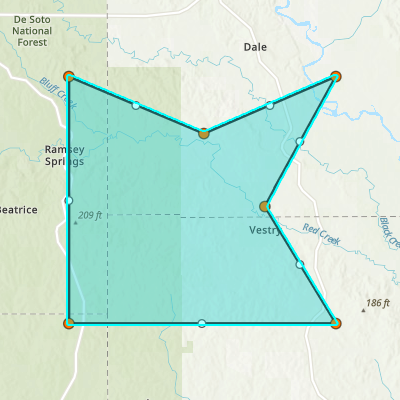
To edit the vertices of a single feature, first select the feature you want to edit. Click inside the selected feature to show the control points for the vertices. The larger orange control points are for the existing vertices. You can click and drag one to translate the corresponding vertex, or you can click and hit delete to remove the vertex. The smaller cyan control points allow you to add vertices to the geometry by simply clicking and dragging on the control point.
Note: all of the features drawn on the map will be used in analysis
Upload shapefile
If you already have a shapefile that defines your area of interest, you can upload it to the tool to use for analysis. In the Region panel, select the Upload tab and click Upload File.
Note: the shapefile must be compressed into a ZIP file and should only contain polygons
Analysis
After you have defined your area of interest, you can perform an analysis by clicking on the
 button. A summary of the results, including a breakdown of vision tiers and land cover, will appear in the Analysis panel.
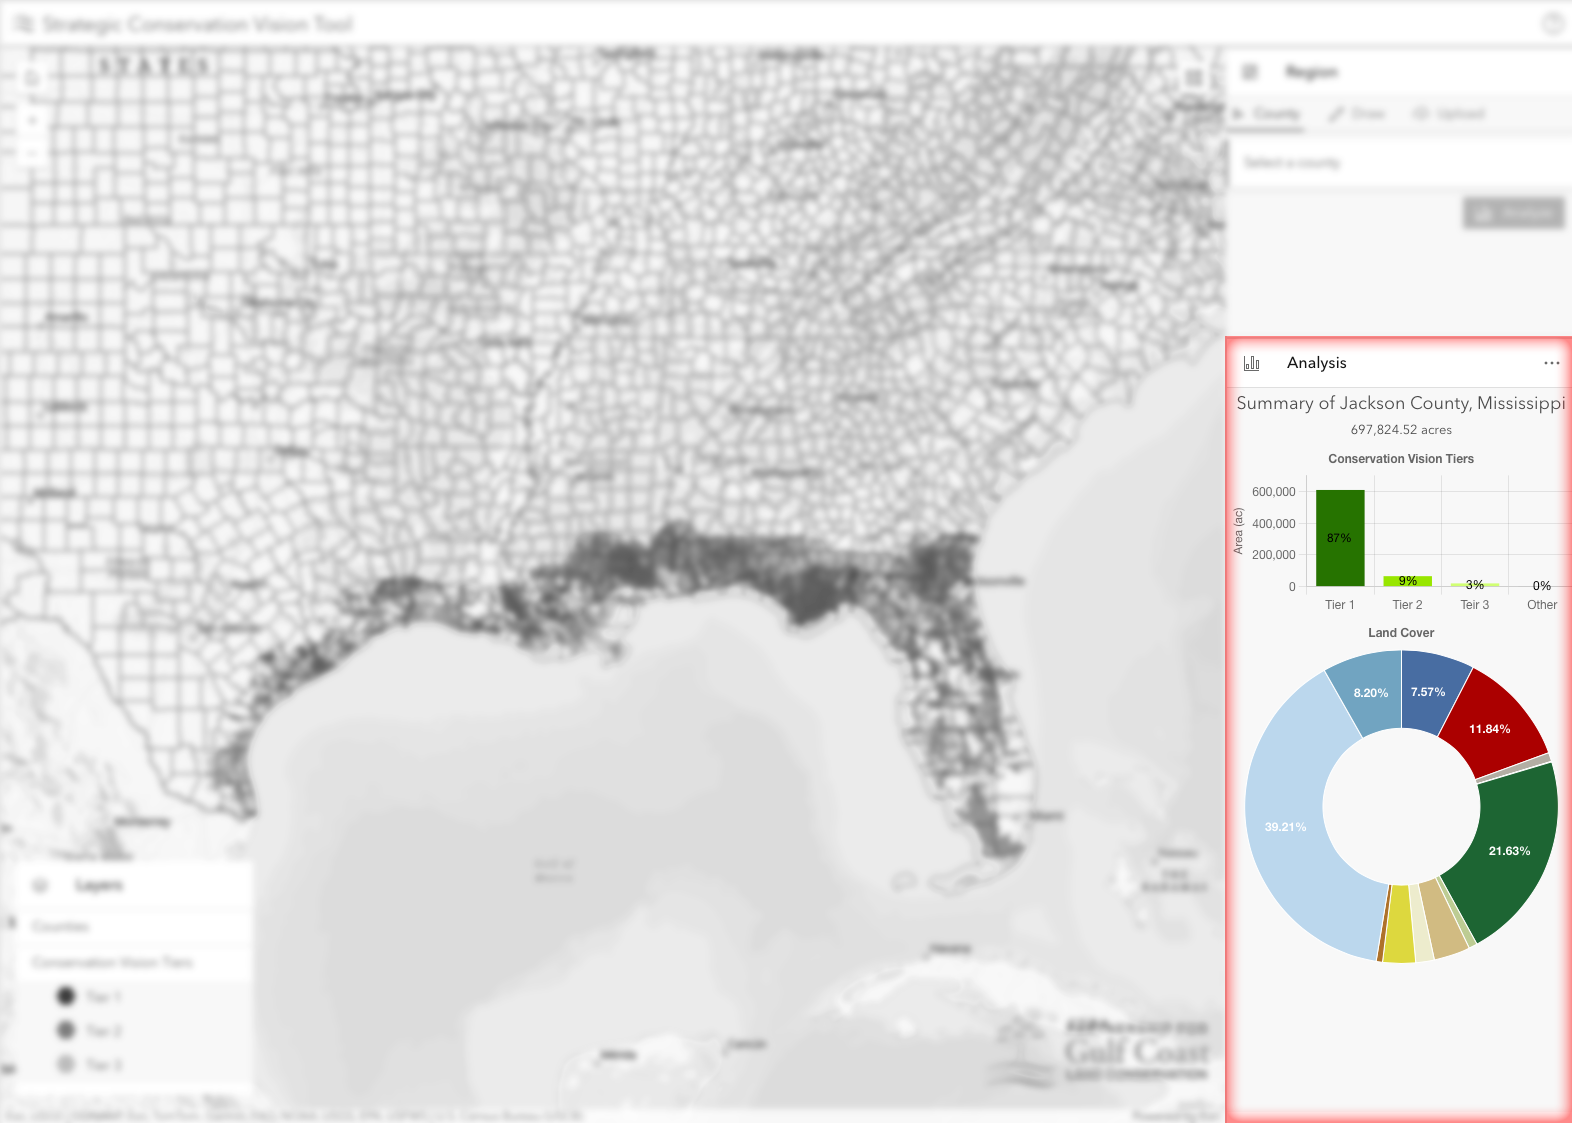
More options, such as reset, full report, and export, are accessible from the